A new freshwater threat atlas asks which pressure to tackle in each watershed
A global study links freshwater species to overlapping pressures. Its watershed maps offer a starting point for conservation, with limits that matter locally.
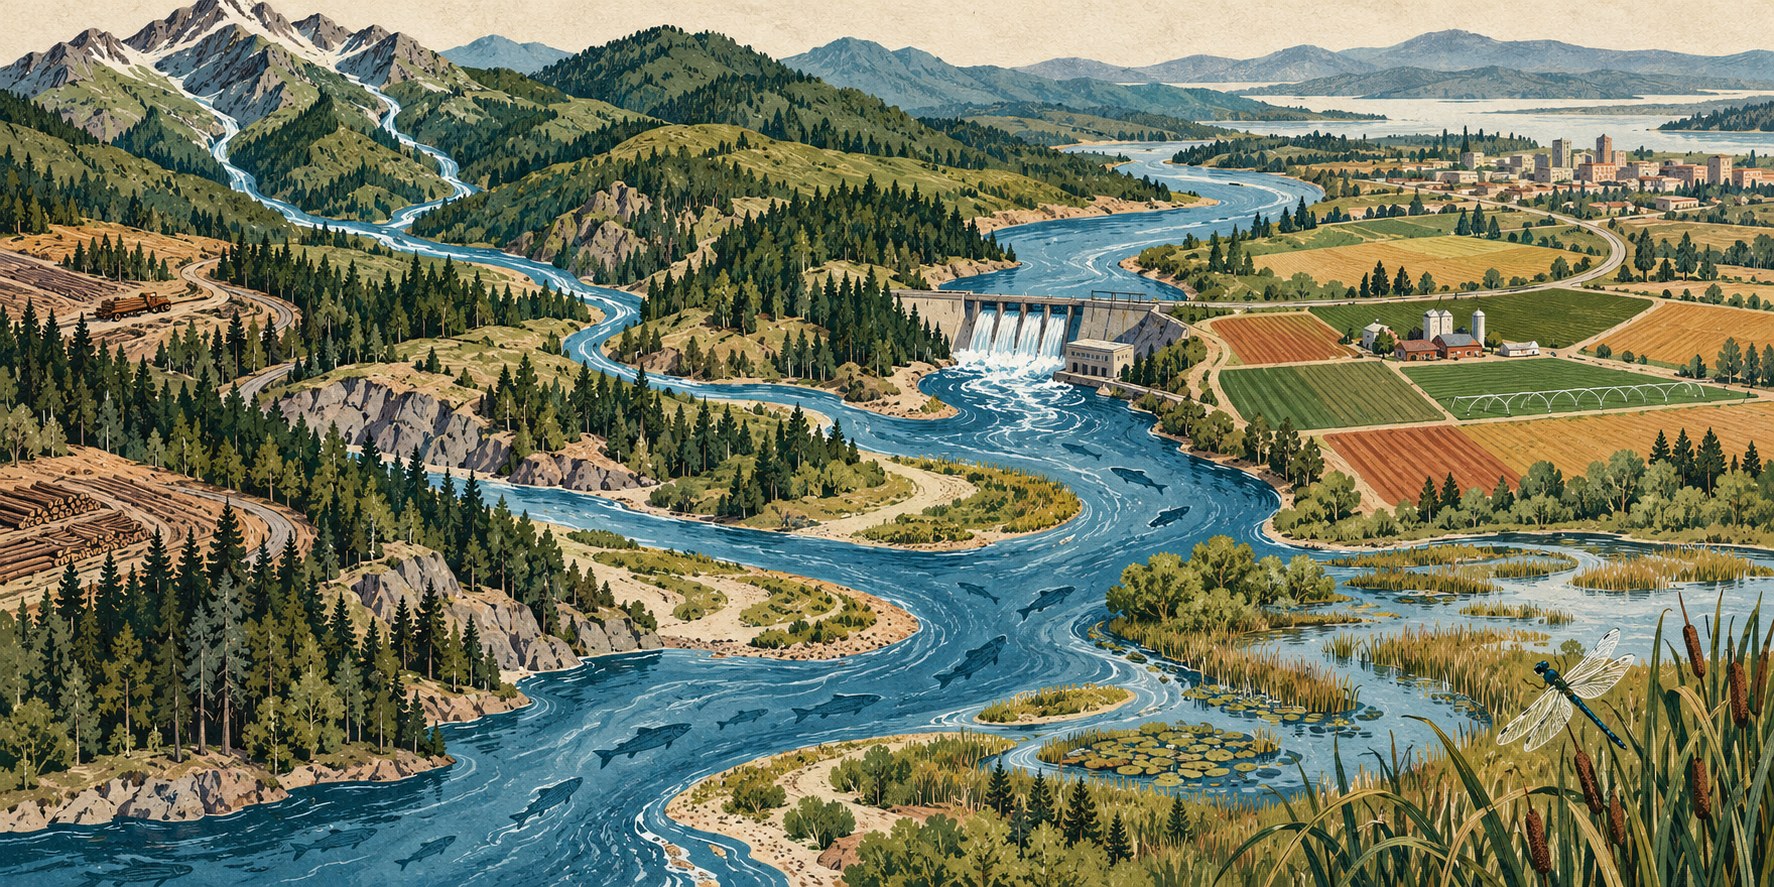 Editorial visualization
A river’s conservation problem can change with the animals being considered. In a new global assessment, agricultural activities feature prominently for amphibians and dragonflies, while hunting stands out for freshwater reptiles and mammals. The practical question is which pressure conservationists need to address in a particular place.
The study, published in Science on October 29, maps 45 threats across 21,490 freshwater species. According to McGill University’s account of the research, farming, dams and agricultural runoff are the leading pressures globally, with Europe and Northwest Africa among the hardest-hit regions. The result is a way to compare overlapping threats, rather than treat freshwater conservation as a single problem everywhere.
Building the map around species
The authors’ Dryad documentation explains how the analysis connects IUCN species-range maps and threat assessments to sub-watersheds. Separate statistical models estimate threat probabilities for each animal group. Combining these layers produces a broader picture of pressure across freshwater habitats.
That geographic unit has a purpose. HydroBASINS, the underlying mapping framework, divides drainage basins into nested sub-basins and records their upstream and downstream relationships. It gives researchers a consistent way to organize river catchments around the world, instead of relying on administrative borders.
McGill reports that the team produced 225 maps, covering each threat across five animal groups: fish, amphibians, reptiles, mammals, and odonates—the group containing dragonflies and damselflies. It also reports that freshwater threats have different spatial patterns from those found in earlier terrestrial-biodiversity mapping.
Reading an estimate carefully
A modeled threat probability should not be read as a real-time pollution measurement, or as the chance that an individual animal will die. It describes an estimate built from species and threat information. That distinction matters before turning a global pattern into a claim about one stretch of water.
The repository describes uncertainty information accompanying the threat maps. Its October 30 update was a cleanup of the analysis code, with no change to the dataset; that date should not be mistaken for a new ecological finding.
UpThat examined the authors’ repository documentation, the university’s research account republished by Phys.org, and HydroBASINS documentation. The full Science paper was not accessible during this review, and the analysis has not been independently reproduced here.
For a conservation team, the atlas can help frame the next investigation: which species occur in a catchment, which pressures overlap there, and what local evidence would establish their severity? Choosing an intervention still requires that closer view. A broad threat layer can point attention toward a watershed; it cannot by itself decide the best action within it.