FAO’s food index fell 1.2%. Rice and sugar went the other way.
October’s international food-price average eased, but it concealed rising rice and sugar quotations. The November 6 release measures traded commodities, not a household grocery bill.
 Editorial visualization
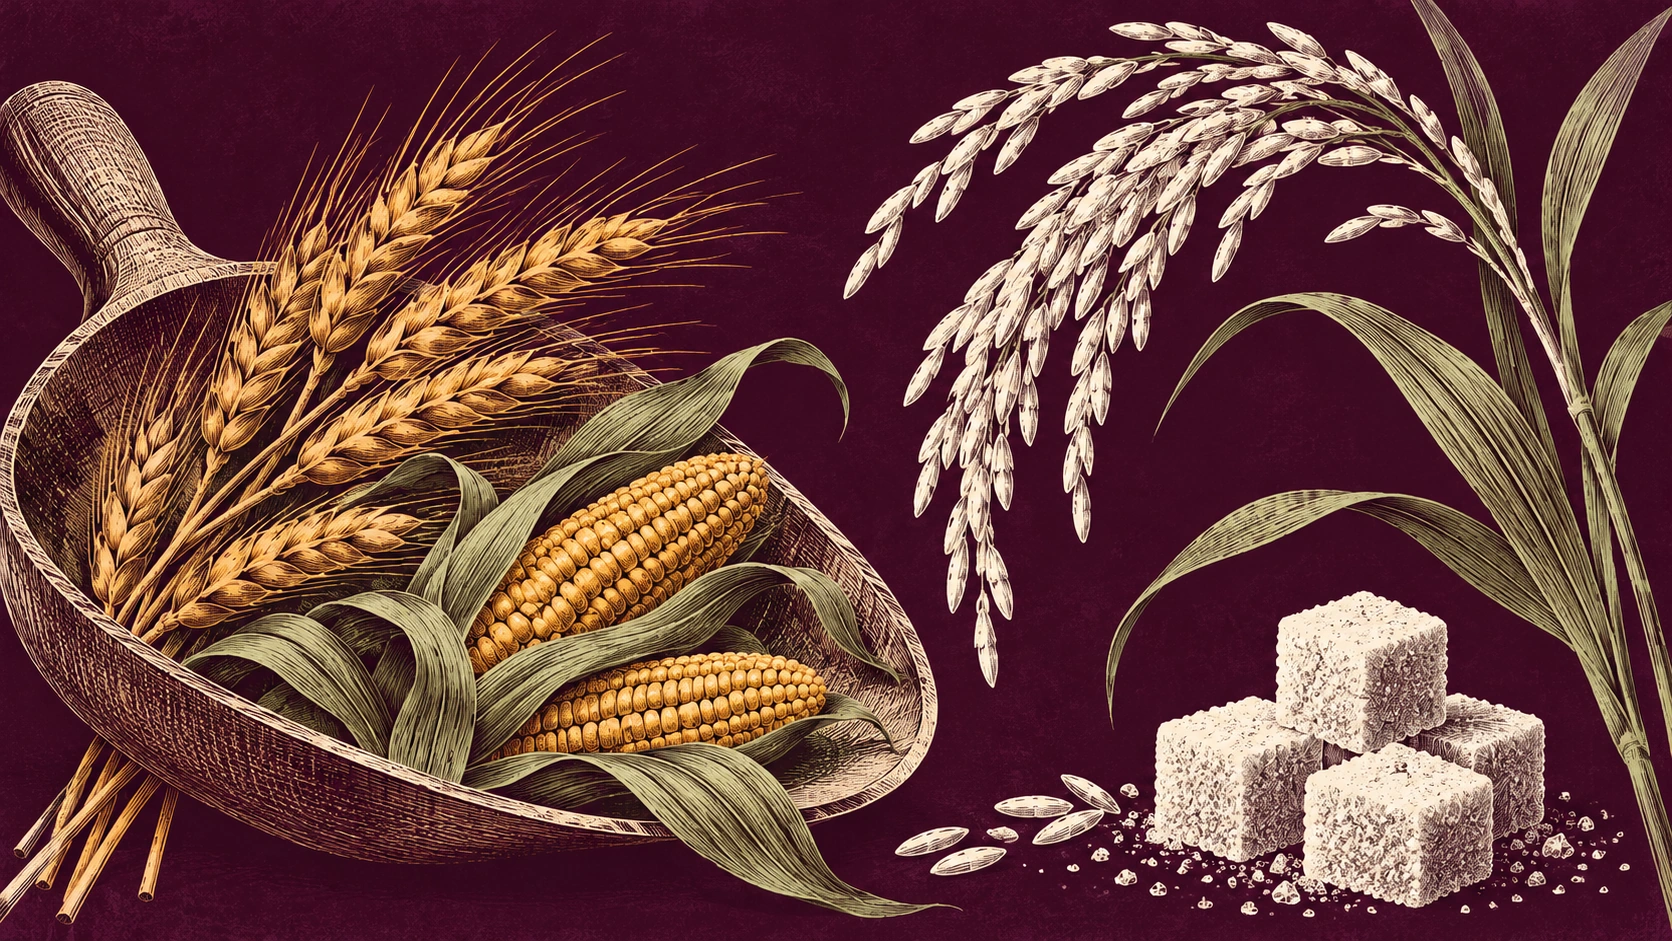
World food commodity prices eased in October, but two important staples moved in the opposite direction. The FAO release published on November 6 put its overall index at 133.9 points, down 1.2% from September and still 5.9% higher than a year earlier. International rice quotations rose 1.6%; sugar jumped 6.6%.
The split is the useful news for food buyers: an improving average does not describe every ingredient. A business purchasing rice or sugar faced a different international price signal from one buying wheat, even before local transport, processing and retail costs entered the calculation.
Rice rose inside a falling cereal average
The October index breakdown shows declines in cereals, meat and dairy, alongside increases in vegetable oils and sugar. Rice is part of the cereal picture, not a sixth equally weighted component of the headline index.
| Index or sub-index | Monthly change |
|---|---|
| Overall FAO Food Price Index | −1.2% |
| Cereals | −4.5% |
| All Rice Price Index (within cereals) | +1.6% |
| Meat | −1.2% |
| Dairy | −1.1% |
| Vegetable oils | +0.3% |
| Sugar | +6.6% |
FAO attributes the fall in wheat quotations to subdued international demand and a better production outlook, particularly in Argentina. US harvesting pressure and expectations of ample South American supplies weighed on maize. Black Sea logistics remained a constraint even as expectations of easier export flows helped push prices down.
Rice followed different supply conditions: harvest delays in some exporting countries added to pressures from adverse weather and rising costs. That explains why the cereal average can fall while rice rises. It does not establish the price paid for a particular rice variety in a particular country.
Sugar’s increase had its own harvest story
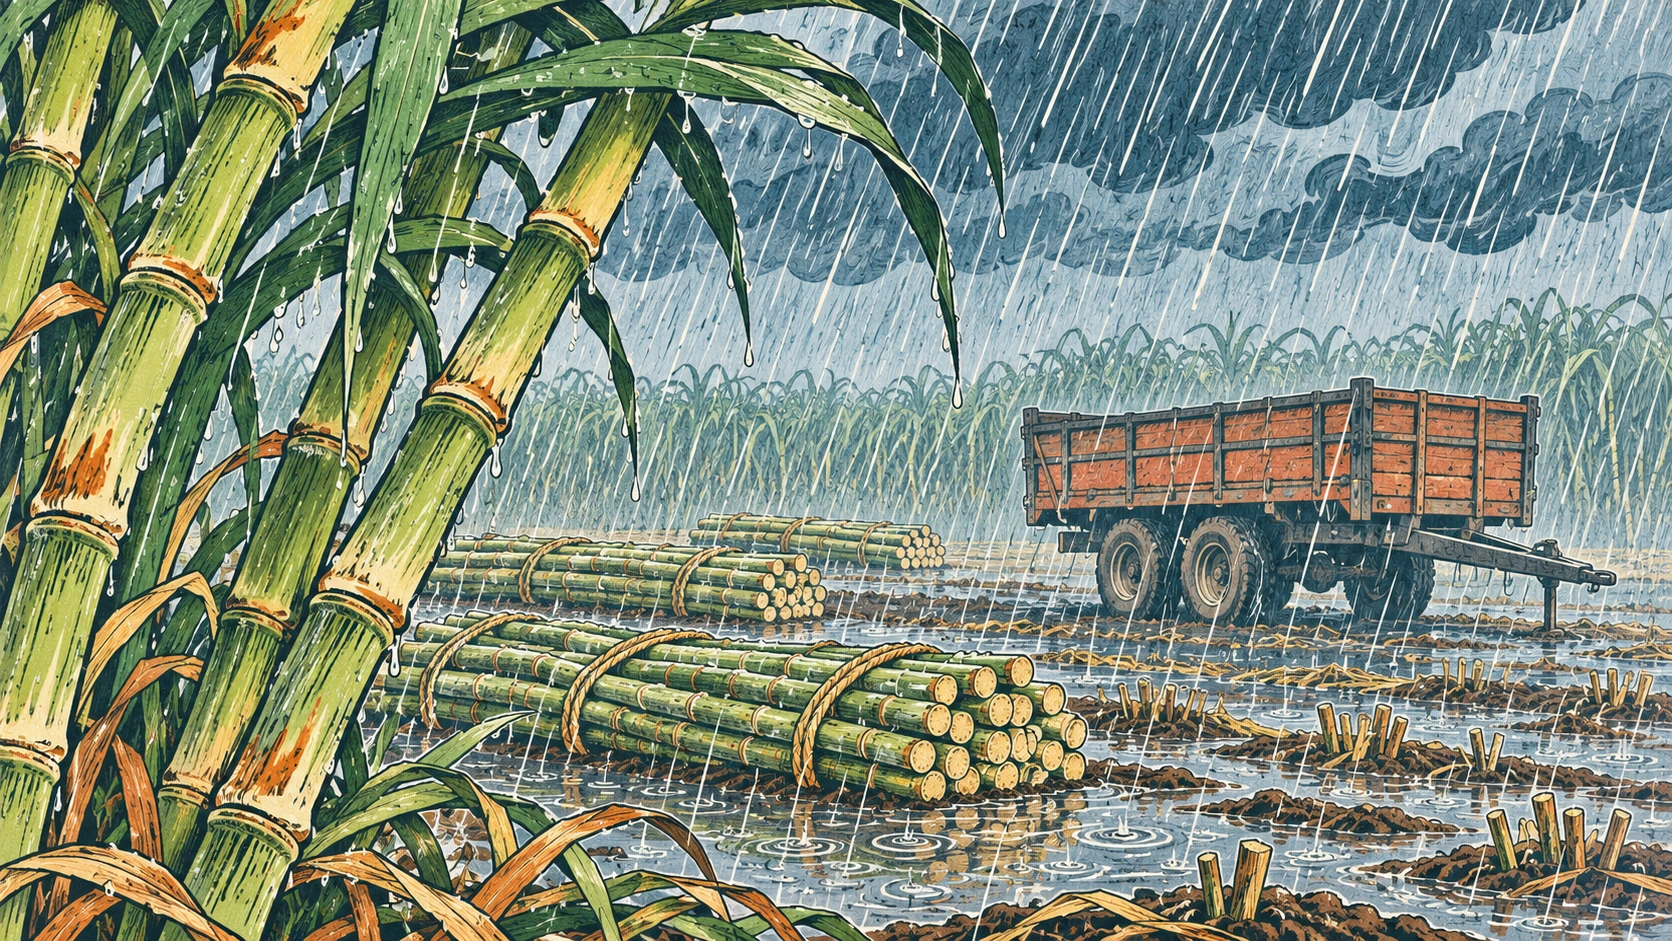
Sugar recorded a fourth consecutive monthly increase and stood 28.8% above a year earlier. FAO linked the rise mainly to rain disrupting cane harvesting and crushing in Brazil’s Centre-South, alongside concerns about future production in India, the European Union and Thailand. Those production concerns are expectations, not completed harvest outcomes.
 Editorial visualization
For an ingredient buyer, these differences argue for checking the relevant commodity and delivery market rather than using the overall index as a purchasing shortcut. The monthly figures describe what happened in October; they are not a forecast of November quotations.
The index stops well before the checkout
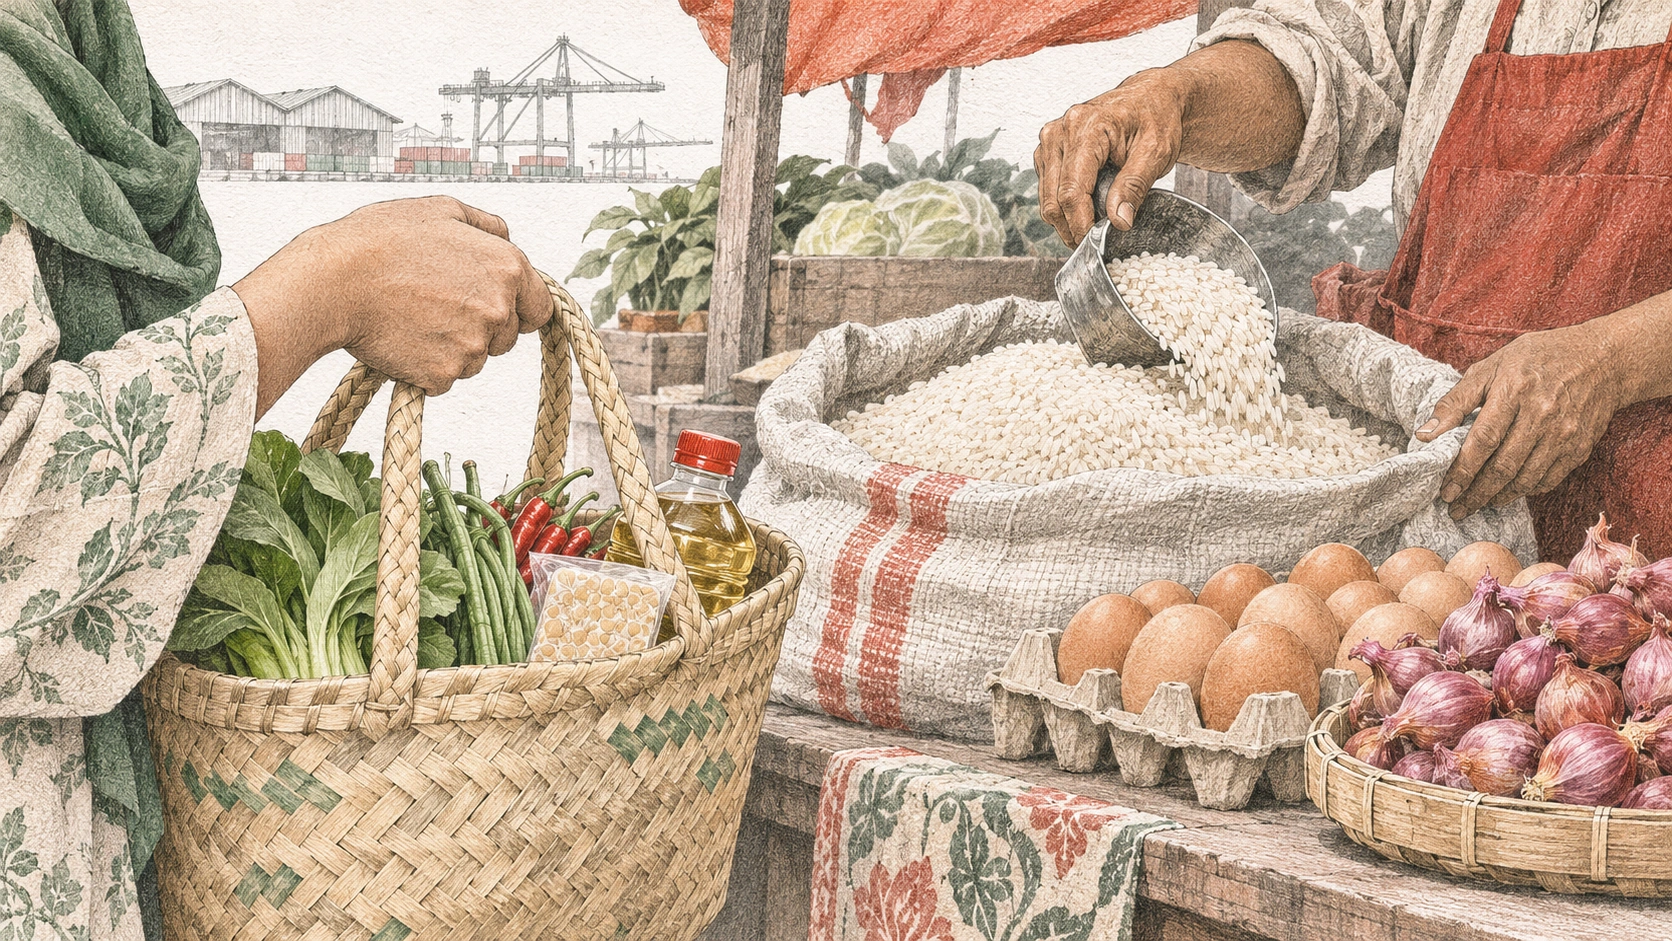
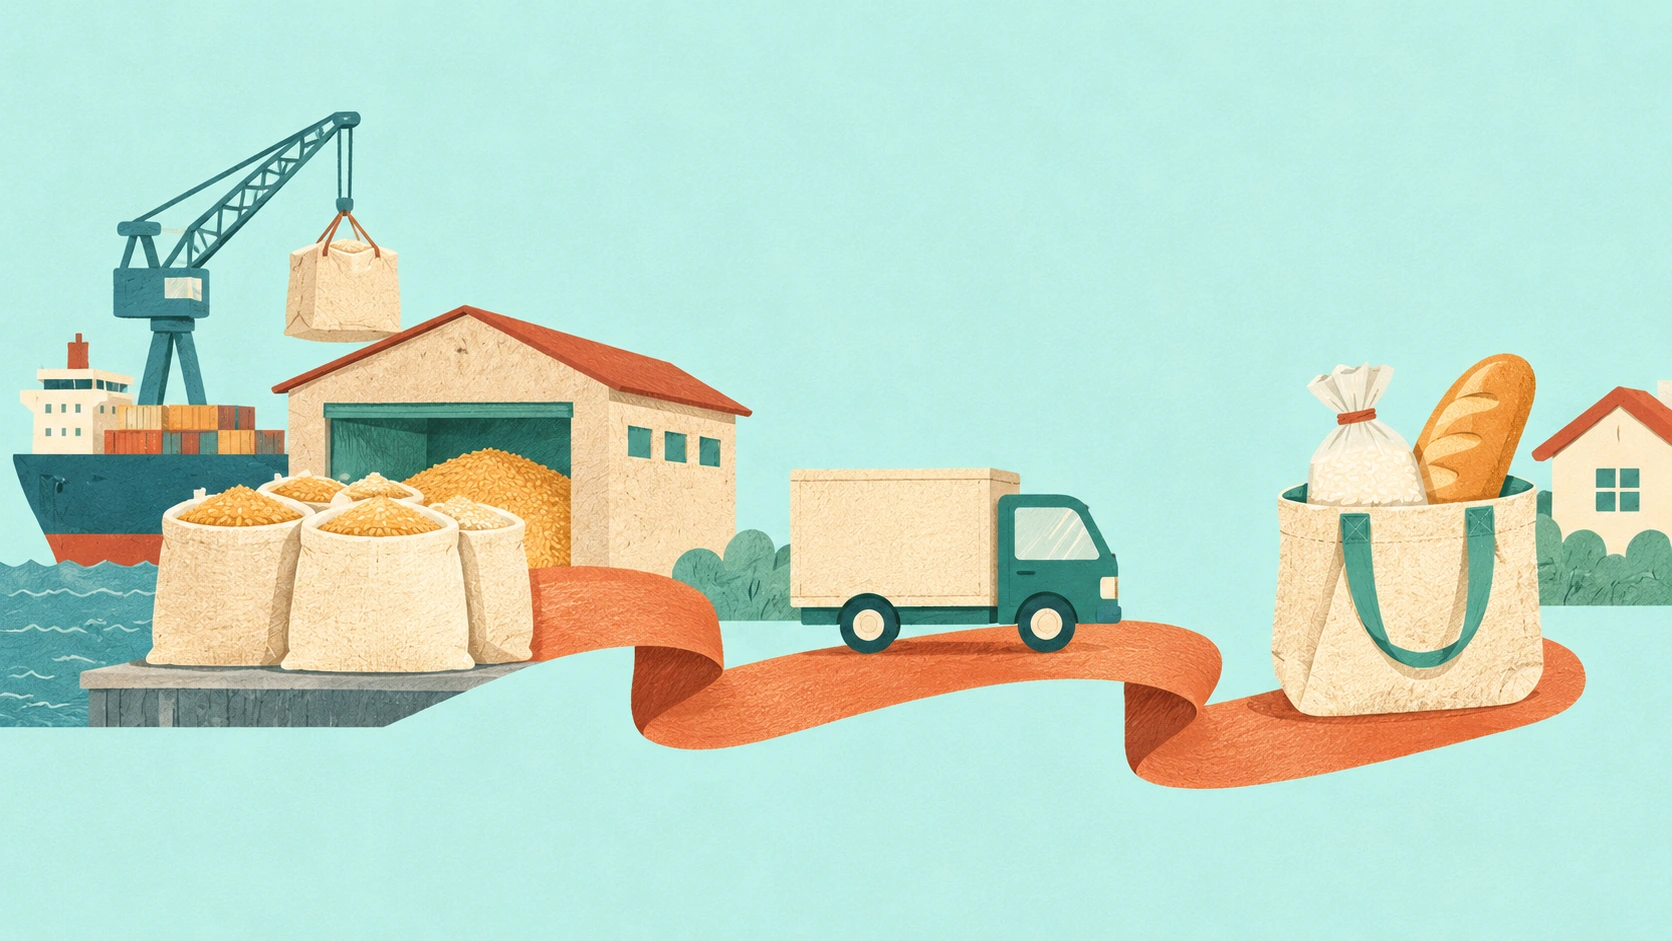
FAO’s price definitions distinguish international trade prices from farm-gate, wholesale and retail prices. The headline food index combines five commodity groups using their average export shares in 2014–2016. A household consumer-price basket instead follows what people buy, and retail prices include the seller’s costs and margin.
 Editorial visualization
The practical consequence is that a global commodity decline need not appear as an equal reduction in a shop. These are different products, different stages of the supply chain and different weighting systems. The FAO reading alone cannot establish whether an Indonesian household’s grocery bill fell.
There is also a revision caveat: recent meat-price readings combine observed and projected quotations because many prices are unavailable at publication time. Revisions can affect both that component and the headline index. The figures above follow FAO’s current November 6 release.
For a local price question, FAO points readers to domestic wholesale and retail monitoring as well as consumer-price indices. The next useful comparison is the same food, at the same market level, over the same dates—not a world export average against a single shopping receipt.
Publication history
— First published.
No published corrections or earlier versions.
How this was made
UpThat uses AI-assisted research and writing. Source checking and publication follow our editorial review workflow. See the original documents above to assess the reporting.
How we use AI ↗